Carbon footprints
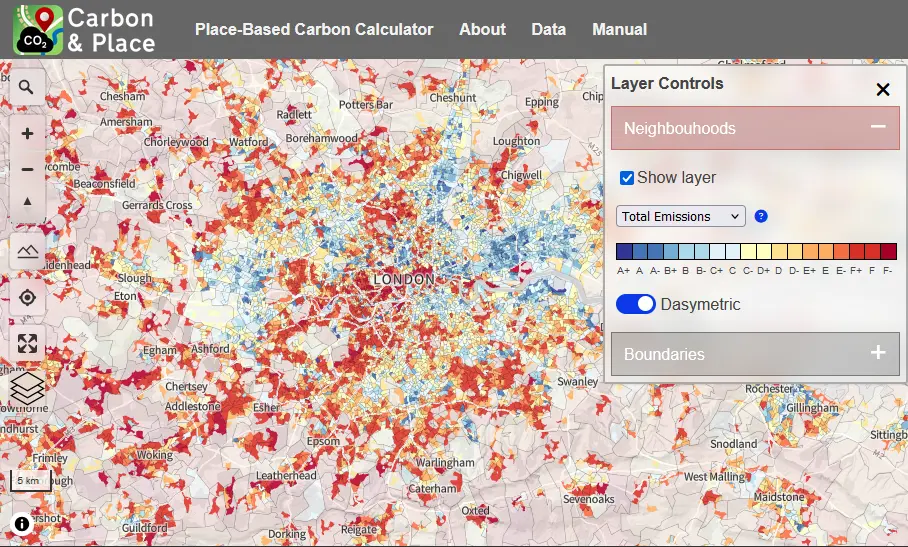
Place-Based Carbon Calculator v2
The new version, with updated data and wider coverage. See how neighbourhood carbon footprints vary across Great Britain.
Open toolInstall the Carbon & Place App
Three steps for anyone new to Carbon & Place.
Enter a postcode above for a combined local report, or open a tool and click any neighbourhood on the map.
Each tool covers a different subject. Colour the map by any measure and open the detailed reports.
Compare your neighbourhood with its local authority, ward, and constituency, then share any view by copying the web address.
Every tool has help buttons that explain each map and chart, and the manual covers everything in more depth. Many of the figures are modelled estimates rather than measurements, and each chart says which it is and how far to trust it. If you spot something wrong, please report it on GitHub or through the feedback form. All the analysis code is open, and the repositories are listed in the Carbon & Place organisation.
The new version, with updated data and wider coverage. See how neighbourhood carbon footprints vary across Great Britain.
Open tool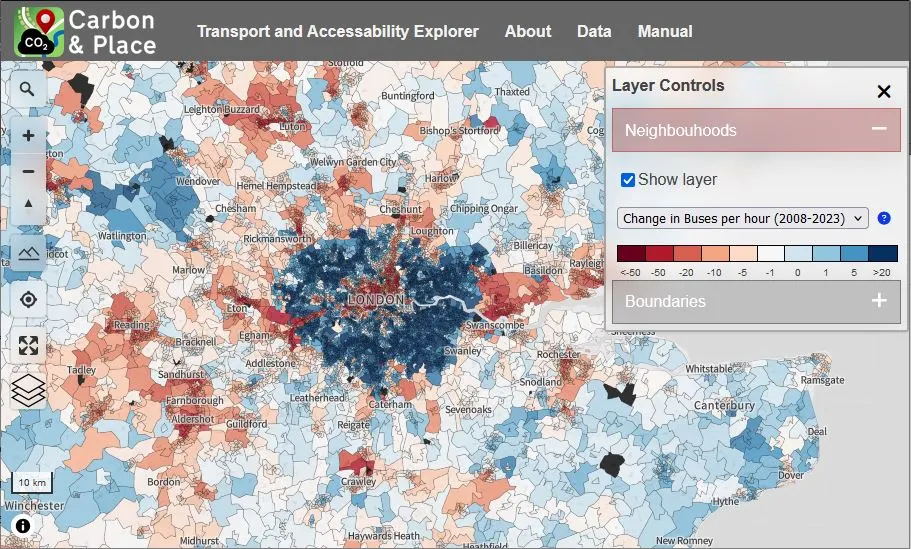
Transport is the largest source of UK greenhouse gas emissions, and the slowest sector to decarbonise. Examine how travel options and accessibility vary across the country.
Open tool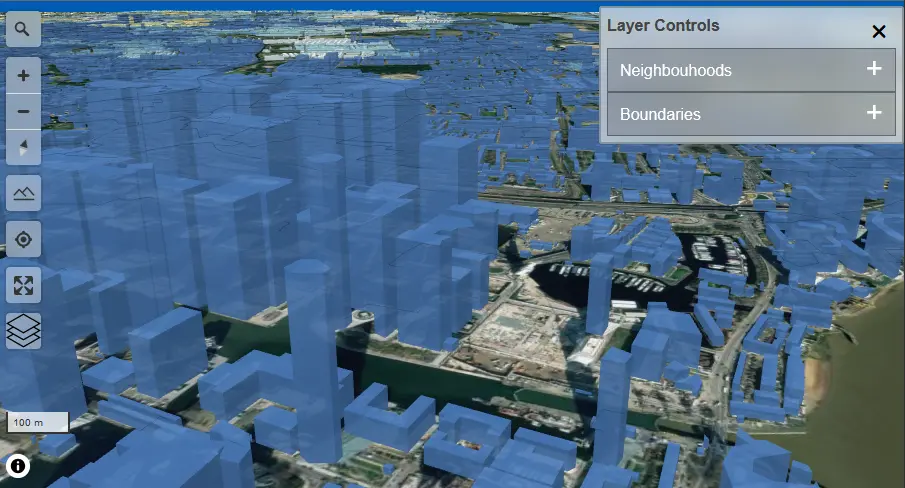
British homes are among the least energy efficient in western Europe. Explore detailed data on buildings, their energy use, and their running costs.
Open tool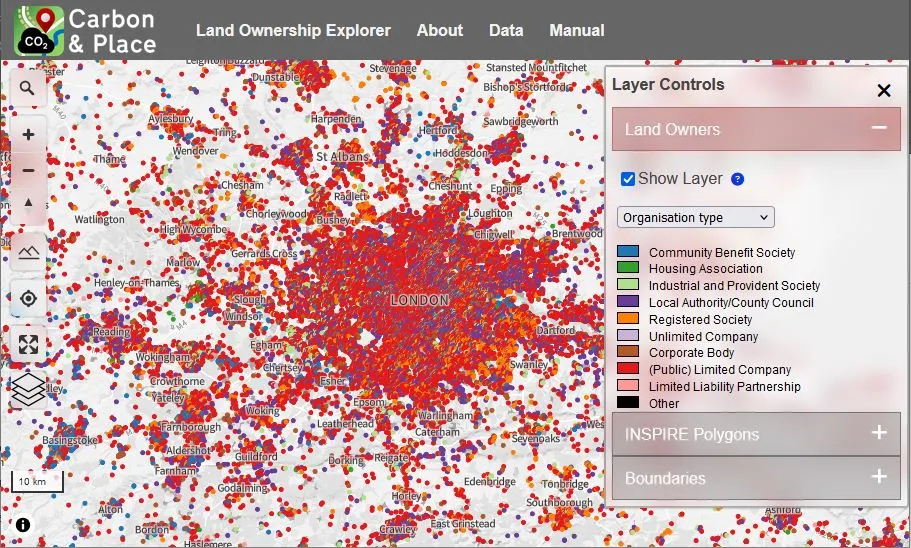
Who owns land shapes how it is used. Explore Land Registry data on company and overseas ownership in England and Wales.
Open tool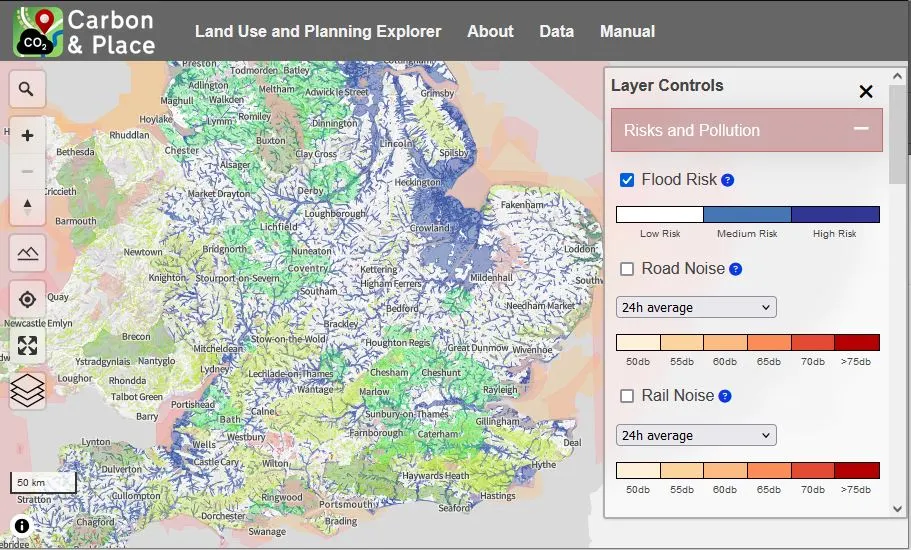
How land is used affects housing, farming, and nature. Explore planning designations, environmental constraints, and protected places, mostly in England.
Open tool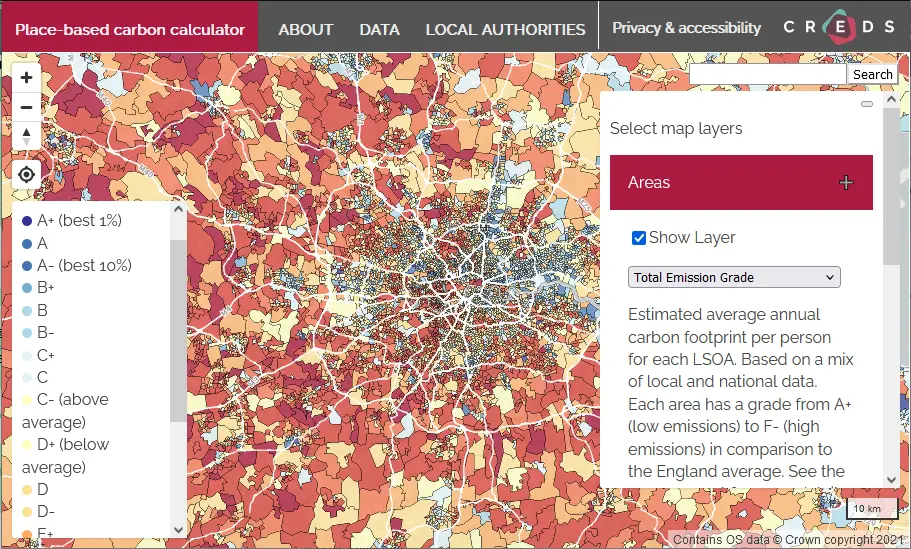
The original 2020 tool from CREDS, covering England. Now being archived ahead of the new version above.
Open toolExplains how to use each tool and provides the background context and methods behind the maps.
Read the manualMuch of our data is free to download and reuse under an open licence for your own analysis.
Browse data