About Carbon & Place
Carbon & Place is a family of tools developed at the University of Leeds as part of the Energy Demand Research Centre, within its Place theme. The centre maintains a project page describing the work.
A new name, the same mission
In 2020, with the support of the Centre for Research into Energy Demand Solutions (CREDS), we launched the Place-Based Carbon Calculator, the PBCC. The tool was intended to help communities, planners, and policymakers understand how carbon footprints vary from place to place and what can be done to reduce them. The PBCC was a big success, widely used by people across England, and received several updates. In 2023 CREDS reached the end of its funding period and closed down, and the newly established Energy Demand Research Centre (EDRC) agreed to take on and expand the PBCC for the next five years. The PBCC became part of the EDRC Place Theme, and in 2024 this website was relaunched as Carbon & Place.
The rebrand was more than cosmetic: the PBCC became one of many tools offered by Carbon & Place. This allows us to go into more detail about specific topics, such as transport or retrofits, while also expanding and improving upon the original PBCC. Carbon & Place will be updated regularly with new features and improvements.
How do you use Carbon & Place?
Most of the tools are interactive maps of Great Britain. You can pan and zoom around the country and change the data shown on the map using the menu bar on the right of the screen. Clicking on any of the neighbourhoods shown on the map will bring up a local report card. The report card contains more information on how the carbon footprints were calculated, as well as comparisons with other areas. The report card also gives useful information about contributing factors such as how well insulated homes are or how far the average person drives per year.
Free, for everyone, forever
The tools on Carbon & Place are developed as open-source software and, as far as possible, use open data. All of the tools are free to use, and most of the data is free to download. We believe taxpayer-funded research should be transparent and accessible, so we document our data and methods as fully as we can, including the assumptions and the gaps. In many places the tools have help popups (look for the ) that provide more information, or you can view all the documentation in the manual.
You can find all our source code on GitHub, and most of our outputs are free to download.
In a limited number of cases, the licensing terms of the data we use mean we cannot publish datasets in full. In these cases, we provide details on accessing the original data.
This website is licensed under a GNU Affero General Public License v3.0. For data download and licence rules see the data page.
Citing Carbon & Place
If you reference Carbon & Place or use screenshots or extracts from the tools in publications, please cite:
Morgan, M. (2026). Carbon & Place: Data and tools to understand the spatial variation in carbon footprints. Environment and Planning B: Urban Analytics and City Science, 53(3), 538–554. https://doi.org/10.1177/23998083251401613
Who created Carbon & Place and how was it funded?
Carbon & Place was produced with funding from UK Research and Innovation, the Engineering and Physical Sciences Research Council, and the Economic and Social Research Council through the Energy Demand Research Centre, grant reference number EP/Y010078/1.
The original PBCC was produced with funding from UK Research and Innovation through the Centre for Research into Energy Demand Solutions, grant reference number EP/R035288/1.
The Team
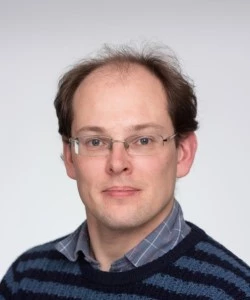
Malcolm is a specialist in GIS with an interest in low carbon transport and housing.
Members of the original PBCC Team (2020-2023)

Jillian has worked on mobility patterns, local policy evaluation and transport and decarbonisation for over 15 years.

Karen has 20 years’ experience of social research in transport and mobilities employing a variety of mixed methods approaches to issues of mobility, accessibility, and social justice.

Mark has 30 years’ experience as a transport planner spanning policy and strategy formulation as well as scheme development and delivery.

Steve has 15 years’ experience in transport planning and economic development working across both the private and public sectors.
How we use AI
AI coding assistants have been used to help build Carbon & Place. Because our tools are used to inform decisions about real places, we think you are entitled to know where AI has been involved, where it has not, and what we do to make sure it has not quietly introduced errors.
Where AI is used
- Writing and reviewing code. Parts of the analysis pipeline and this website were written with the help of an AI coding assistant, working under direction from the research team. The result is treated like any other code: it is read, tested, run, and published in full on GitHub, where anyone can check it.
- Drafting and editing text. Some of the documentation, including parts of the manual and this website, was drafted or edited with AI assistance. The methods being described, the caveats attached to them, and the conclusions drawn from them are the research team's, and every page is reviewed before publication.
- Auditing our own work. We use AI to cross-check the analysis against what the website says the analysis does, which is a tedious job that machines are good at. The August 2026 audit is an example: it compares the pipeline with the published site, ranks what it finds by severity, and backs every finding with a file reference and a value read from the built outputs. Audits report; they do not change code on their own.
Where AI is not used
- No number on this website is generated by AI. Every figure we publish is produced by the analysis pipeline, which is ordinary R code running over the published input datasets listed on the data page. There is no language model anywhere in that pipeline. Run the code on the same inputs and you get the same answers.
- We do not use machine learning models. Where the analysis estimates something rather than measuring it, it does so with conventional and documented statistical methods: iterative proportional fitting to build synthetic households, deterministic and fuzzy string matching to join addresses, and a physical model of solar radiation. These are described in the manual and none of them is a black box.
- AI does not decide what the data means. Judgements about what a result shows, how far it can be trusted, and what should be said about its limitations are made by the research team.
The safeguards
- Everything is open. Code that AI helped write is published under an open licence along with everything else. This is the main safeguard, because it means our work can be checked rather than taken on trust.
- Reproducibility rather than trust. The pipeline is built with targets, which tracks how every output depends on every input. A result stands because the code and the source data produce it, not because anything, human or machine, asserted it.
- Checking against independent evidence. Where we can test our results against a source that was produced without us, we do. The public transport analysis, for example, is validated against operators' own published timetables, because only the operator's document can say which of the competing data sources is right.
- Tests on the parts most likely to break quietly. The stages where a subtle error would be hardest to spot, such as address cleaning and matching, have regression tests that run against known cases.
- AI involvement is recorded. Commits made with the assistant carry a co-author line in the git history, so the record of where it was used is public and permanent rather than something you have to take our word for.
- A person is accountable. Carbon & Place is the responsibility of a named researcher at the University of Leeds, and that does not change because a tool was used along the way. AI is not an author of this research and is not credited as one.
None of this makes mistakes impossible, and we would rather say so than imply otherwise. Errors in our work are more likely to come from the difficulty of the underlying data than from how the code was written, which is why the manual documents assumptions and gaps as carefully as it documents methods. If you find something that looks wrong, please report it.